Oregon State University's energy dashboard.
Overview
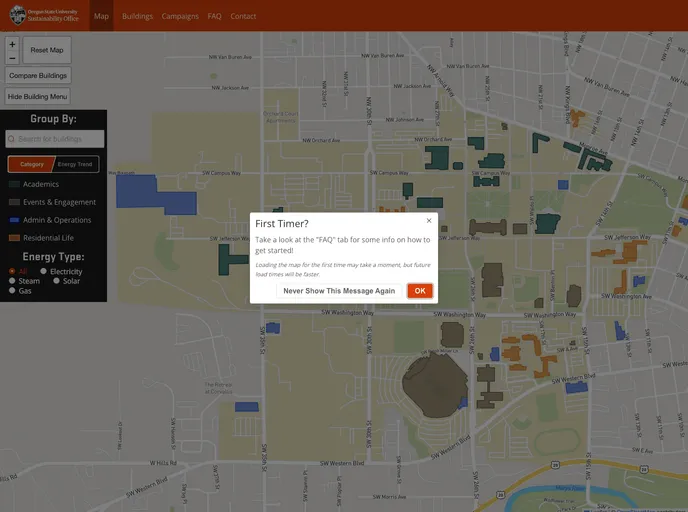
The OSU Energy Dashboard is a dynamic tool crafted by the Oregon State University Sustainability Office, aimed at helping members of the OSU community monitor and analyze energy consumption trends effectively. This innovative dashboard serves as a user-friendly interface where individuals can access important data and insights related to energy use on campus. With an emphasis on sustainability, this platform encourages users to engage with energy data in a meaningful way.
Built with modern web technologies, the OSU Energy Dashboard not only showcases energy statistics but also supports local testing and development, making it an excellent resource for both casual users and developers alike. Whether you’re looking to understand energy patterns or contribute to the project, this dashboard has something to offer for everyone.
Features
- User-Friendly Interface: The dashboard provides an intuitive design that simplifies navigation and allows users to easily access and interpret energy consumption data.
- Energy Consumption Trends: View detailed analytics and historical data to track energy usage patterns and identify areas for improvement.
- Local Development Support: The application can be run locally for testing and development, making it easy for contributors to engage with the codebase.
- Test Build Availability: A test version of the dashboard is easily accessible for users to explore new features before they go live.
- Contribution Recognition: A ‘Hall of Fame’ highlights contributors to the project, fostering a sense of community and encouraging collaboration.
- Comprehensive Documentation: Detailed README.md files provide guidance on using and contributing to the dashboard, ensuring that users can navigate the system effectively.