Vue.js component for Apache ECharts.
Vue Echarts is an impressive integration of Apache ECharts, designed specifically for the Vue.js ecosystem. This component brings the powerful visualization capabilities of ECharts into Vue applications, allowing developers to create stunning and interactive charts and dashboards with ease. The seamless integration makes it an excellent choice for anyone looking to enhance their data representation within Vue.js projects.
By leveraging Vue’s reactive capabilities, Vue Echarts ensures that your visualizations stay in sync with the underlying data. Whether you’re building applications for analytics, reporting, or just visual data explorations, Vue Echarts provides a flexible and robust framework that’s easy to implement and customize as per your needs.
Reactive Data Binding: Vue Echarts utilizes Vue’s reactivity system, automatically updating charts as data changes, creating a dynamic user experience.
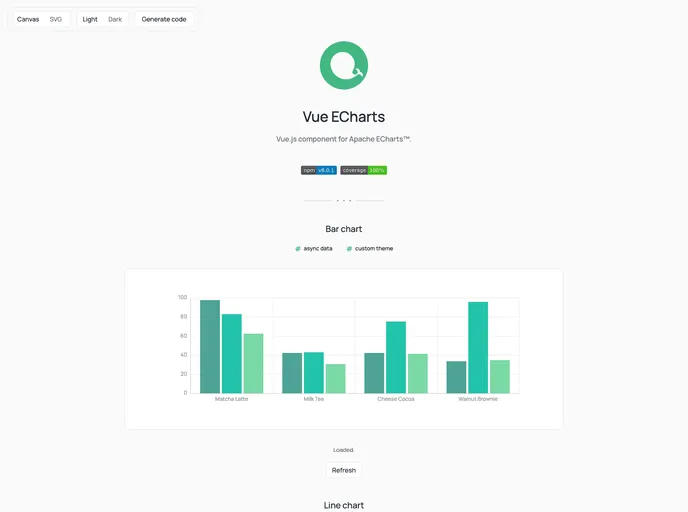
Wide Range of Chart Types: From line and bar charts to pie charts and scatter plots, this component supports a variety of visualization types to meet diverse data presentation needs.
Customization Options: Users can customize nearly every aspect of the charts, including colors, labels, tooltips, and legends, allowing for a tailored look and feel.
Responsive Design: The component automatically adjusts layout and sizes based on the viewport, ensuring charts look great on all devices.
Built-in Interactivity: Vue Echarts supports interactions such as tooltips, zooming, and data selection, enhancing user engagement with the visualizations.
Easy Installation and Setup: The component can be integrated into projects with minimal setup, making it accessible even for those new to Vue.js.
Rich Documentation: Comprehensive guides and examples help users quickly get started and fully leverage all the capabilities of the library.