Lightweight Vue component for drawing pure CSS donut charts
The Vue CSS Donut Chart is an elegant and customizable component built for Vue.js, designed to visualize data through a donut-shaped chart. With its easy-to-integrate API and responsive design, it caters to developers looking to enhance their applications with engaging and informative data representations. Whether you need a simple donut chart for basic analytics or a detailed visualization with multiple sections, this component is versatile enough to meet various requirements.
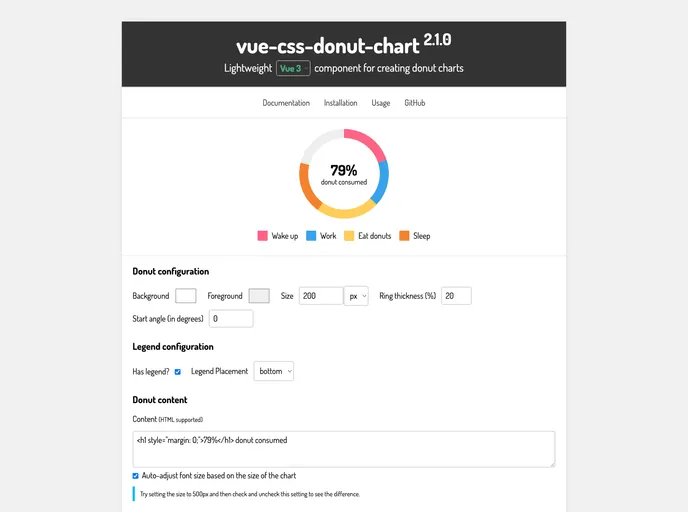
The component allows for complete customization, including size, thickness, colors, and even text representation within the donut. This flexibility makes it suitable for a wide range of applications in dashboards, reports, or any data-driven UI.
size prop, which can take any positive value for a tailored look.unit prop, enabling responsive designs depending on your layout needs.thickness prop, providing options from minimal to full donut coverage.text prop, or utilize the default slot for more complex content.background and foreground colors to match your application’s theme, ensuring cohesive aesthetics.has-legend prop and determine its position with legend-placement, enhancing chart readability.auto-adjust-text-size prop ensures text is proportionally resized based on available space, improving visibility.sections prop to create a multi-segmented donut, providing rich data visualization capabilities with custom colors and labels for each section.This combination of features makes the Vue CSS Donut Chart a robust choice for any Vue.js project focused on visualizing data effectively.